
Fig. 3.
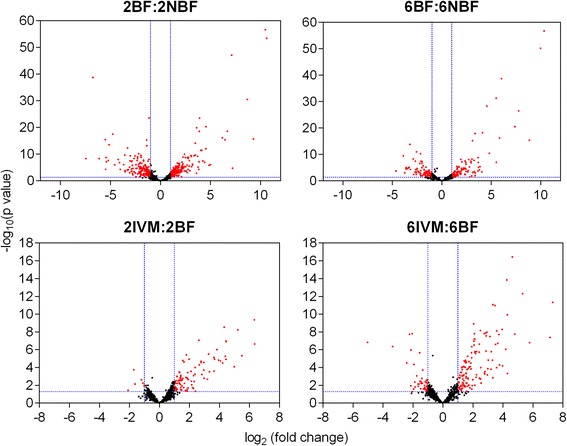
Visualization of differential expression using volcano plots. Differential gene expression depicted as volcano plots for the BF:NBF and IVM:BF contrasts at both age points. Horizontal blue dotted lines indicate significance threshold (p < 0.05) whereas vertical lines indicate fold-change threshold (≥2-fold). Red points represent significantly differentially expressed transcripts by these criteria. Positive x-values represent up-regulation and negative x-values represent down-regulation