
Fig. 5.
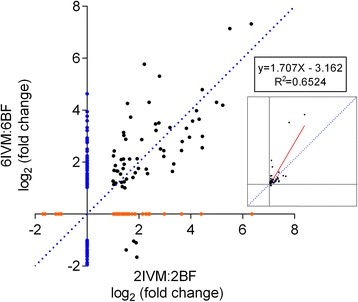
Linear regression analysis comparing the gene expression after IVM ingestion between age groups. 62 transcripts were common to both contrasts while an additional 124 transcripts were unique to the 6-day contrast and 39 were unique to the 2-day contrast. Four transcripts showed a different direction of DE between the two contrasts while the remaining 58 showed the same direction of DE. The larger plot shows log2 transformed fold-change values while the smaller plot shows untransformed data and the accompanying linear regression line and equation