Fig. 1.

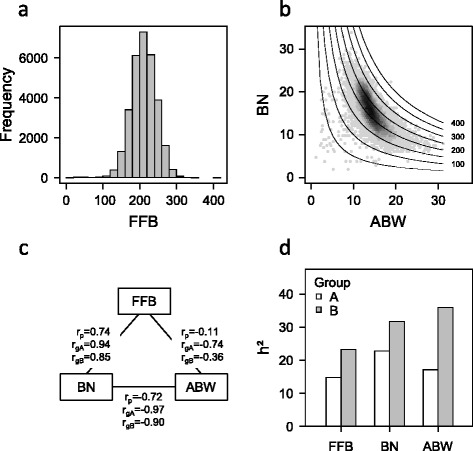
Production trait variations in oil palm A × B population. a Distribution of fresh fruit bunch weight (FFB). b Relationship between average bunch weight (ABW) and bunch number (BN) in an A × B population. The grey scale indicates the density of points with similar BN and ABW values. Isoproduction curves are drawn with corresponding FFB values given on the right of the curves. cPhenotypic correlations (rp) and genotypic correlations in heterotic groups A (rgA) and B (rgB) between FFB, BN and ABW. d Narrow sense heritability (h2) for the three production traits, i.e. FFB, BN and ABW, estimated from A × B individuals
