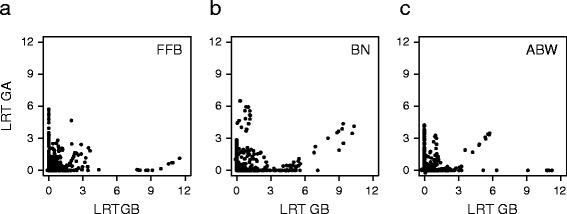
Fig. 4.

Co-localization of QTLs between oil palm heterotic groups. Log-likelihood ratio tests (LRT) for QTL mapping are plotted in heterotic group A (GA) versus heterotic group B (GB) for the three production traits, i.e. fresh fruit bunch (FFB, a), bunch number (BN, b) and average bunch weight (ABW, c)
