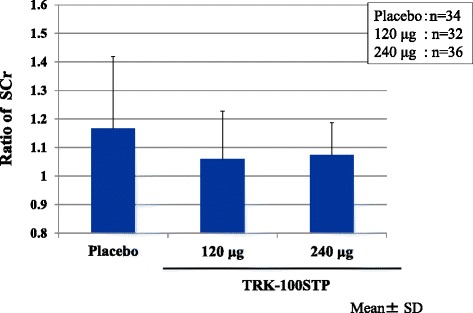
Fig. 6.

Mean ± SD of ratio of SCr (final evaluation point/W0 [week 0 of the treatment period]): As shown in Table 5, both the 120 μg and the 240 μg groups showed an inhibition of the increase in SCr ratios as compared with the placebo group (P = 0.0309, 0.0204, respectively), assessed by ANCOVA with the SCr (R20) as covariate
