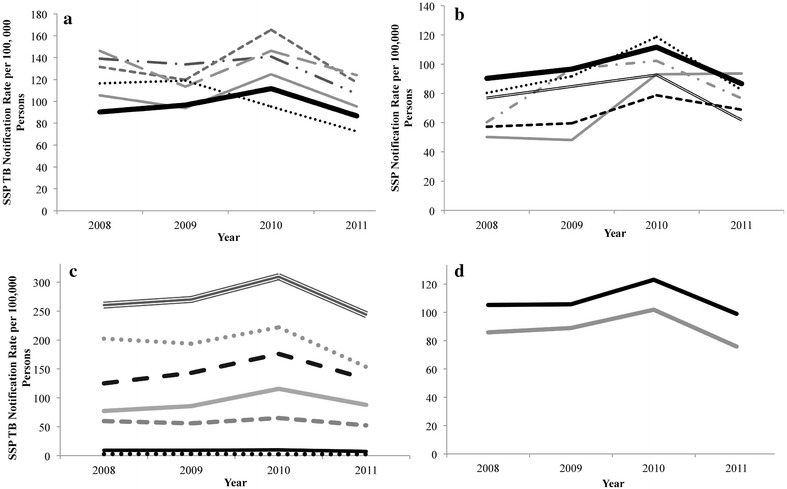
Fig. 1.

The notification rate of sputum-smear positive (SSP) TB in Zimbabwe during 2008–2011 by provinces with SSP TB notification rates above the national average (a), provinces with SSP TB notification rates below the national average (b), age (c), and sex (d) during 2008–2011. a
 Harare/Chitungwiza City;
  , Bulawayo;
  ; Matabeleland South;
  , Manicaland;
  , Matabeleland North;
  , National. b
 Mashonaland West;
  Mashonaland East;
  , Mashonaland Central;
  , Midlands;
  , Masvingo;
  ,National. c
 , 0–4;
  , 5–14;
  , 15–24;
  , 25–44;
  , 45–54;
  , 55–64;
  ,65+. d
 , Males;
  , Females
