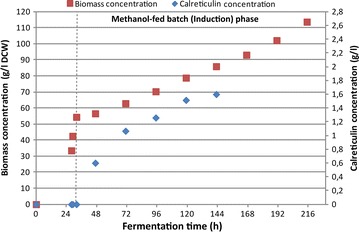
Fig. 8.

Time-course profile of CRT secretion in high-density P. pastoris culture during fed-batch fermentation. Squares represent dry cell weight (DCW), diamonds show concentration of the secreted CRT in the culture medium. 0–28 h indicate glycerol batch phase, 28–29 h—glycerol fed-batch phase, 29–32 h—transition phase, and 32–215 h—methanol fed-batch phase. Only the amount of intact secreted CRT protein form was calculated
