
Figure 1.
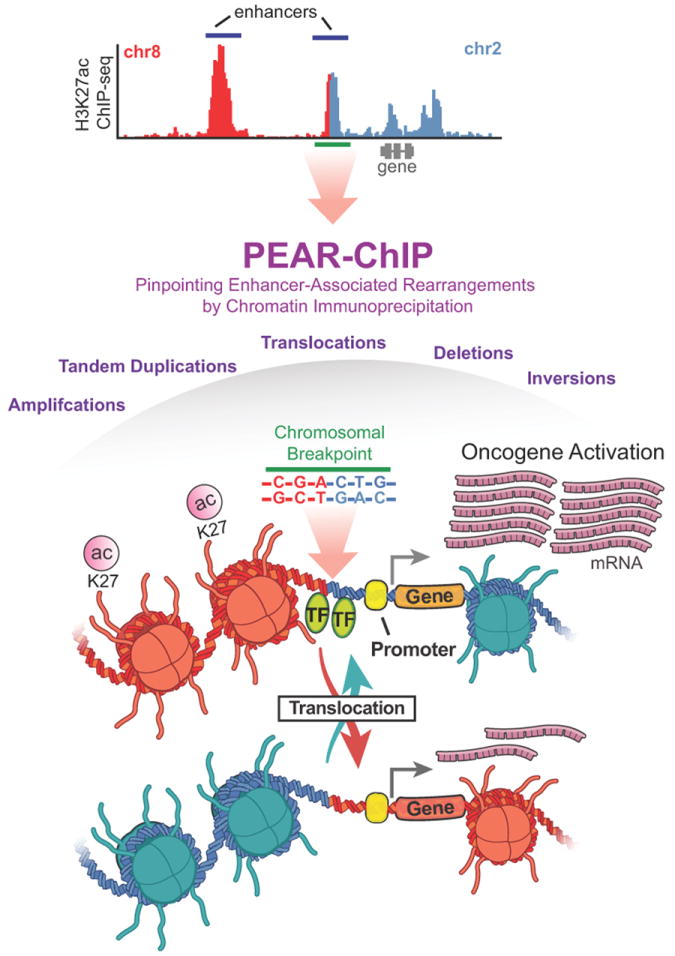
An illustration of the PEAR-ChIP approach used to identify genomic rearrangements within regions of H3K27 acetylation. The top panel is a representative H3K27ac ChIP-seq profile with chromosome 8 reads in red, and chromosome 2 in blue. The breakpoint region is shown as a green bar, and this local region is expanded in a schematic in the lower panel.