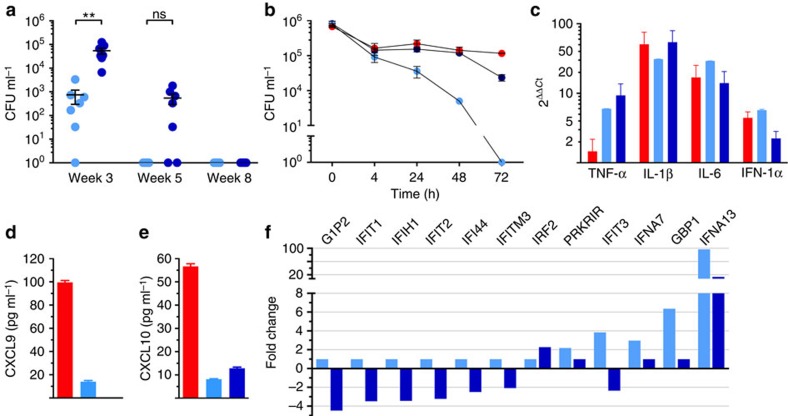
Figure 3. Comparative measures of bacterial burden in BAL following aerosol vaccination and restriction during intraphagosomal culturing in vitro.
(a) BCG (light blue) and MtbΔsigH (dark blue) CFU levels in total BAL samples at weeks 3, 5 and 8 after vaccination. (b) Rhesus macaque BMDM in vitro killing assay in CFU ml−1 with Mtb (red), BCG and MtbΔsigH. **P<0.01 using two-way ANOVA with Tukey's correction for multiple comparisons. Data are means±s.d. (c) Relative expression (2ΔΔCt) of TNF-α, IL-1β, IL-6 and IFN-1α in BMDMs infected with Mtb, BCG and MtbΔsigH using real-time RT–PCR. (d,e) Absolute expression of CXCL9 (d) and CXCL10 (e; pg ml−1) in supernatants derived from BMDMs infected with Mtb, BCG and MtbΔsigH using cytokine analysis assay. (f) Microarray-derived fold changes of gene expression of 12 Type I interferon genes in the BAL of BCG- and MtbΔsigH-vaccinated animals. For analysis involving BAL, samples from all seven animals in each group were used for analysis at each time point (a). For CFU analysis in vitro, the experiment was performed twice, with four biological replicates in each instance (b). Transcript and cytokine analyses were performed on biological replicates (c–f). ns, not significant.

