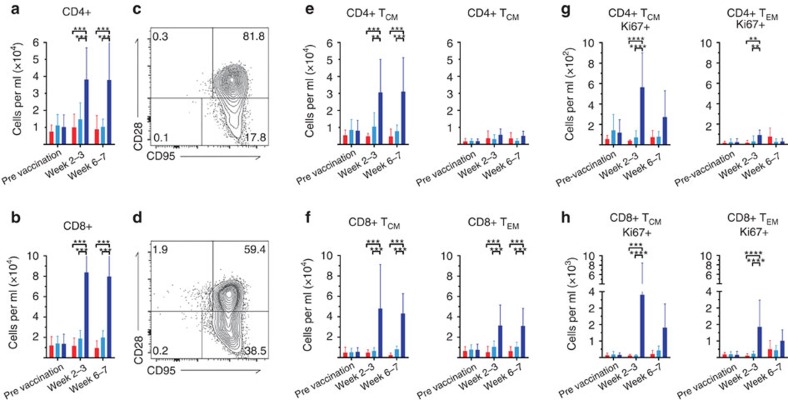
Figure 5. T-cell response to immunization in BAL.
Vaccination with MtbΔsigH (dark blue) induced a significantly higher central memory immune response relative to BCG vaccination (light blue), or no vaccination (red). Quantification of CD4+ (a) and CD8+ (b) T cells migrating to the lung after vaccination. Representative plots of central memory (CD28+CD95+), effector memory (CD28−CD95+) and naive (CD28+CD95−) CD4+ (c,e) and CD8+ (d,f) T cells in BAL. Quantification of CD4+ (e) TCM and TEM cells, CD8+ TCM and TEM cells (f) in BAL, and the proliferative capability of these cells (g,h). *P<0.05; **P<0.01; ***P<0.001; ****P<0.0001 using two-way ANOVA with Tukey's correction for multiple comparisons. Data are means±s.d. BAL samples from all 21 animals (n=7, three groups) were included in the flow cytometry experiments and analyses. Samples from all seven animals in each group were used for analysis at each time point.

