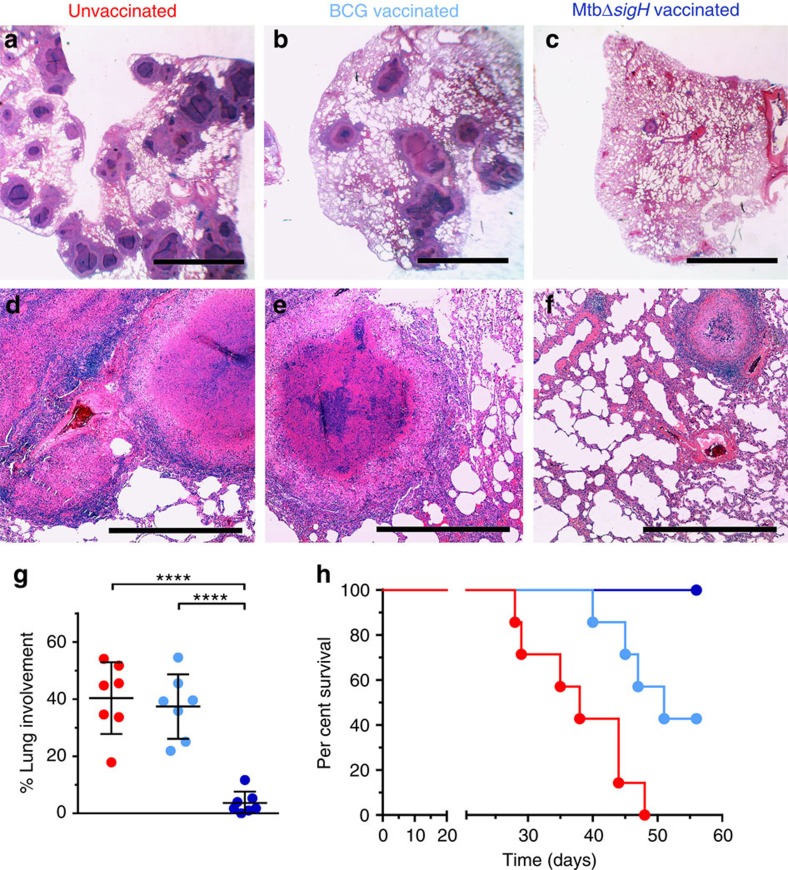
Figure 8. Histopathological and survival analysis of lungs of Mtb-infected animals.
Haematoxylin and eosin (H&E) staining from representative animals in each of the three groups. (a,d) Vaccine-naive group with miliary, white 2–4 mm granulomas and scattered lobular multicoloured areas of consolidation. (b,e) BCG-vaccinated with localized dark red lobar pneumonia and (c,f) MtbΔsigH-vaccinated with no apparent gross lesions. Black scale bars in (a–c), 5 mm and (d–f), 500 μm. (g) Morphometric measures of pulmonary pathology in the different groups of unvaccinated (red), BCG-vaccinated (light blue) and MtbΔsigH-vaccinated (dark blue) animals. ****P<0.0001 with (g) one-way ANOVA using Tukey's multiple testing correction. Data are means±s.d. (h) Survival proportion Kaplan–Meier curves for the three groups of animals, using Mantel–Cox (log-rank) survival analysis. At least three systematic random microscopic fields from each lung, representing most lung lobes, from each of the animals in every group were used for morphometric analysis (g). Data from each of the seven animals per group was used for survival proportions analysis (h).

