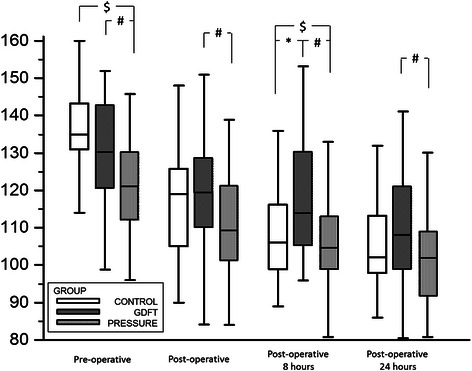
Fig. 3.

Haemoglobin levels in perioperative period. Legend: # - significant difference PRESSURE vs. GDFT groups; $ - significant difference PRESSURE vs. CONTROL groups; * - significant difference GDFT vs. CONTROL groups (all ANOVA with Student-Neuman-Keul’s post hoc analysis); the drop against baseline measurement was significant in all groups and time-points
