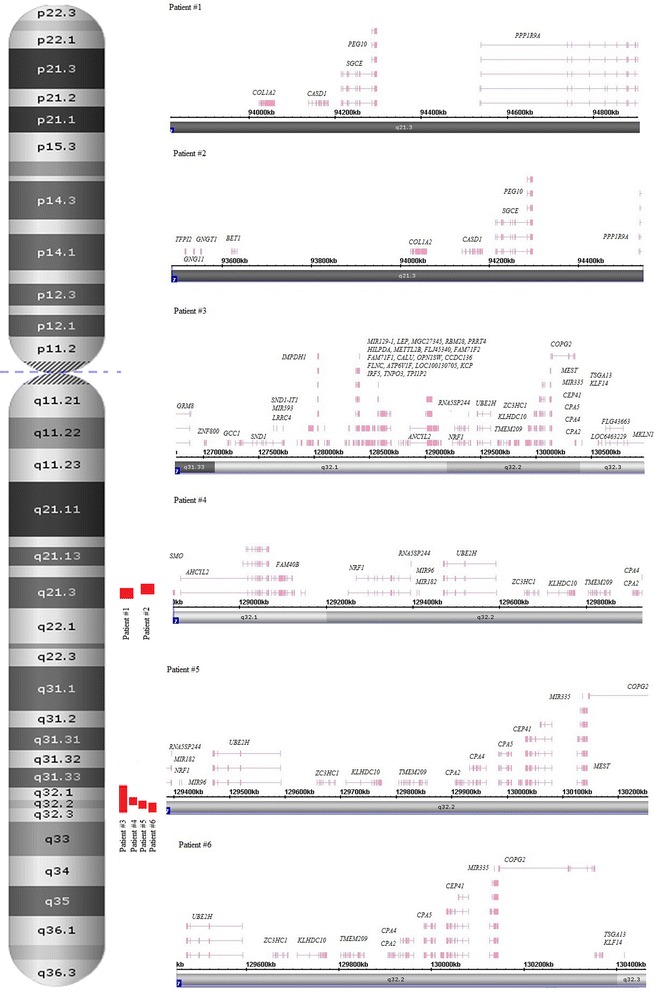
Fig. 1.

Schematic depiction of chromosomal and genomic regions affected by LCHS at 7q21.3 (2 patients) and 7q31.2 (4 patients) using Affymetrix Chromosome Analysis Suite software screenshots

Schematic depiction of chromosomal and genomic regions affected by LCHS at 7q21.3 (2 patients) and 7q31.2 (4 patients) using Affymetrix Chromosome Analysis Suite software screenshots