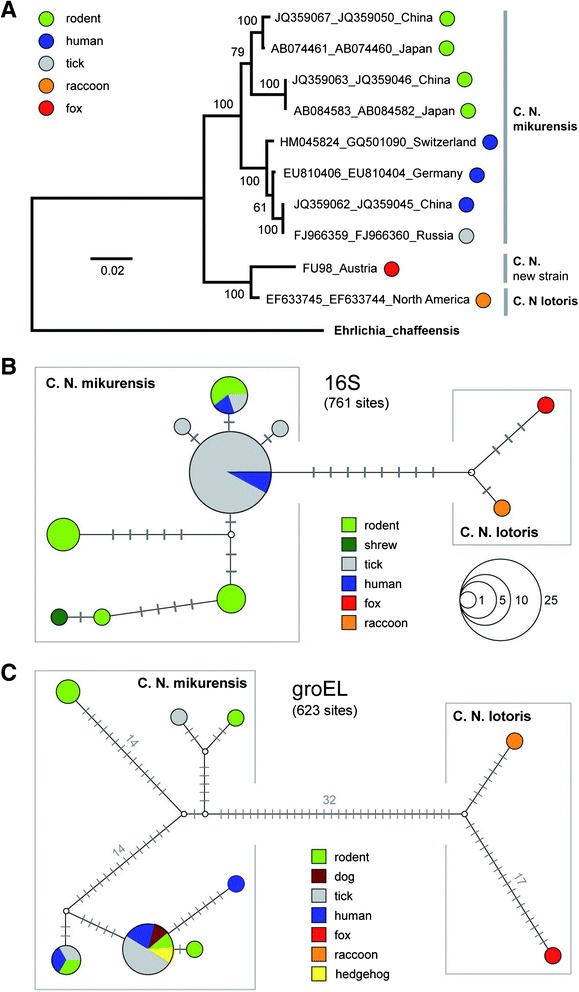
Fig. 1.

a Maximum Likelihood bootstrap tree with 16S and groEL sequences of CNM and CNL. ML bootstrap values are indicated at the nodes. The tree is drawn to scale, with branch lengths measured in the number of substitutions per site. b Median-Joining network with 16S sequences of Candidatus Neoehrlichia. The sizes of the nodes correspond to the number of haplotypes (right lower corner). Grey bars indicate the number of substitutions between haplotypes. c Median-Joining network with groEL sequences of Candidatus Neoehrlichia
