
Fig. 6.
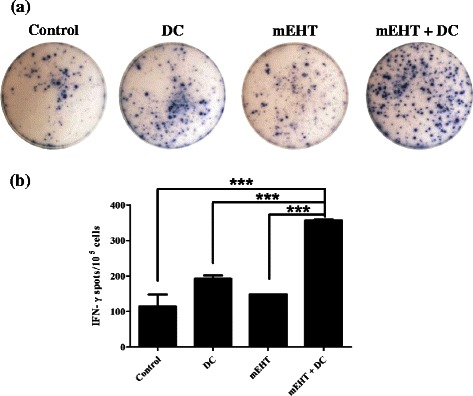
ELISpot assays. a Representative results of ELISpot assay of mice splenocytes that were pulsed with AH1. Top two rows, 2 × 10⁵ splenocytes/well; bottom two rows, 105 splenocytes/well. PC: positive control, splenocytes treated with ConA (5 mg/ml) for 24 h. NC: negative control, splenocytes treated with BSA for 24 h. b Numbers of IFN-γ-secreting T-cells in DC-treated and mEHT + DC-treated mice significantly exceeded those in mice treated with mEHT alone and untreated control mice. Error bars represent standard errors. (***) P < 0.001 (t-test) relative to control. EH: electro-hyperethermia