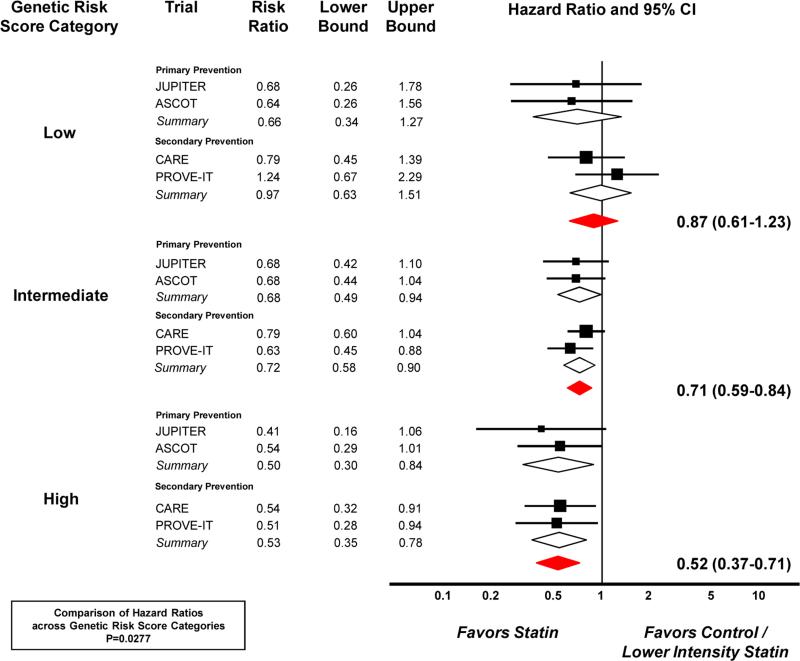
Figure 2. Risk Ratios for Coronary Heart Disease with Statin Therapy across Genetic Risk Score Categories.
The boxes indicate the point estimates, and the size of each box reflects the weight of a trial's data within that subgroup. The horizontal lines display the 95% confidence intervals. The diamonds provide summary data. In PROVE IT-TIMI 22, the control group is moderate intensity statin therapy (pravastatin 40 mg) and the statin group is high intensity statin therapy (atorvastatin 80 mg).

