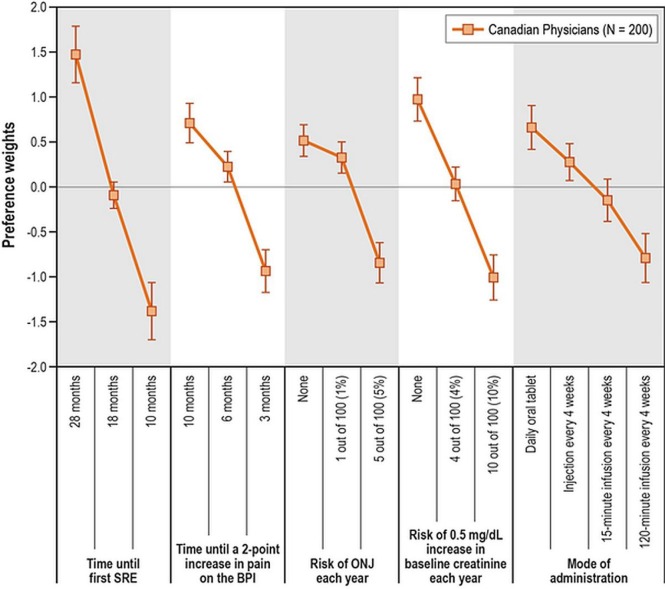
FIGURE 2.
Preference weights. The vertical bars surrounding each mean preference weight denote the 95% confidence interval (CI) for the point estimate; if the CIs for adjacent levels in a particular attribute do not overlap, the mean estimates for those levels are statistically different at the 5% level of significance. However, overlapping CIs do not necessarily imply a lack of statistical significance in the differences between preference weights within an attribute at the 5% level of significance. BPI = Brief Pain Inventory; ONJ = osteonecrosis of the jaw; SRE = skeletal-related event.

