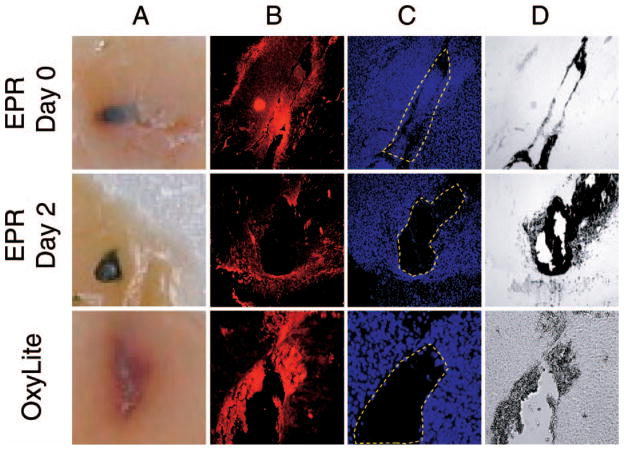
FIG 3.
Effect of the probe implant on the tissue. Sections from RIF-1 tumor prepared after completion of pO2 measurements on the day of implantation (EPR day 0 and OxyLite) and 48 h after (EPR day 2) are shown. Panel A: Unstained visual image (macrophotography) showing the deposition of EPR and OxyLite probes; panel B: fluorescence image of smooth muscle (α-actin) staining showing blood vessels; panel C: fluorescence image of DAPI staining showing nuclei; panel D: a bright-light image of panels B/C. The probe implants are recognized from the void space indicated by the dashed enclosure in panel C.

