
Figure 1.
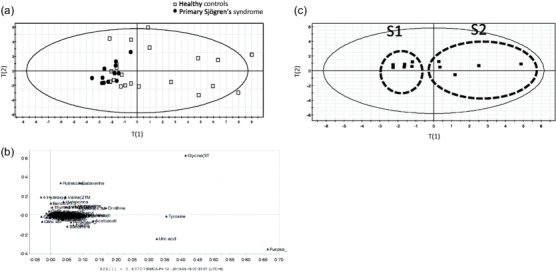
Principal component analysis (PCA) analysis of salivary metabolites. (a) Plot analysis of healthy controls (HC) (◻) and primary Sjögren's syndrome (pSS) (●) PCA scores (PC1 = 0·431, PC2 = 0·192). (b) Loading plot from the PCA analysis comparing salivary metabolite production differences between pSS patients and HCs. (c) PCA analysis of pSS patient scores revealed the presence of two distinct pSS subgroups (PC1 = 0·333, PC2 = 0·297).