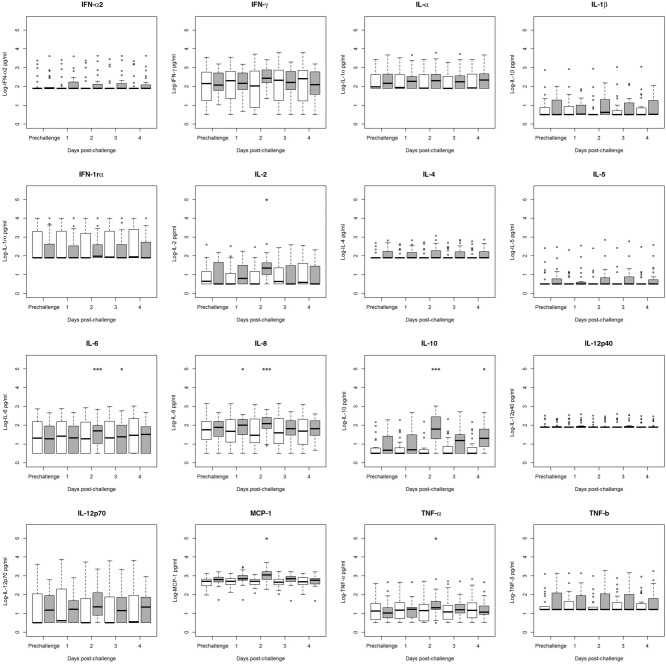
Figure 1.
Comparison of pre- to post-challenge serum cytokine concentrations in norovirus-challenged individuals, stratified by infection status (infected n = 26, uninfected n = 26). Values below the lower limit of detection (LLOD) were assigned to the value of the LLOD. Significance of change from prechallenge value was tested using Wilcoxon's test and is denoted by an asterisk above the relevant category. Interquartile ranges (IQRs) for infected individuals (grey boxes) and for uninfected individuals (white boxes) are shown. Dark lines indicate median values. Whiskers indicate most extreme value that is no more than 1·5 times the IQR away from the bound of the IQR. Circles indicate outliers. *P < 0·05, **P < 0·01, ***P < 0·001.

