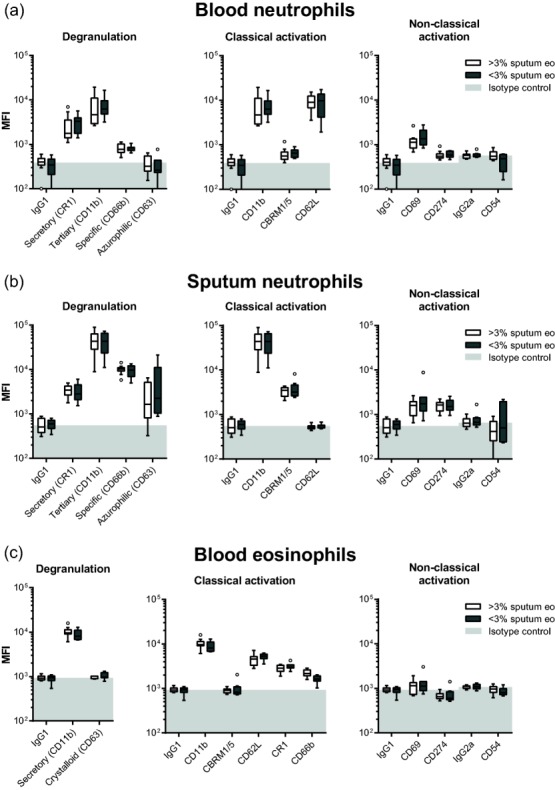
Figure 4.

Expression profiles of sputum granulocytes in patients with presence of absence of sputum eosinophilia. Expression profiles of (a) blood neutrophils, (b) blood eosinophils and (c) sputum neutrophils are similar in patients with the presence or absence of sputum eosinophilia. Boxes represent medians ± interquartile range (IQR) with whiskers of 1·5 IQR, according to Tukey's method. Light grey fills indicate values below the median isotype control. No statistically significant differences were found as determined by multiple Wilcoxon–Mann–Whitney tests with Bonferroni correction (P < 0·05 after multiplicity correction).
