
Figure 5.
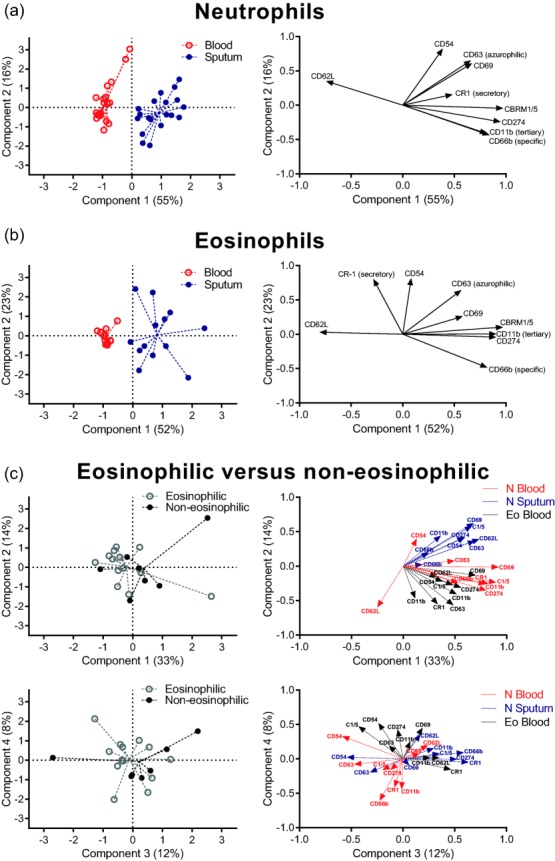
Multi-dimensional analysis of flow cytometric data. Object scores of each patient (left) and loading plots of each marker (right) of principal component analysis (PCA) of receptor expression levels on blood and sputum neutrophils (a) and eosinophils (b). Dashed lines originate from the mean object scores of a group. Component 1 showed a clear separation between blood and sputum cell types with some residual variation explained by component 2. Loading plots indicate the contribution of each marker in a component, with a large distance from 0 indicating a large influence. Markers which are not (differently) expressed remain close to zero on the x-axis, so play little role in the component 1. Markers up-regulated in sputum have positive values for component 1 (e.g. CD11b), whereas down-regulated markers (CD62L) have negative values. PCA analysis did not discriminate between patient groups (c) in any of the four components. Group sizes were 21 (a), 13 (b) and 21 (c).