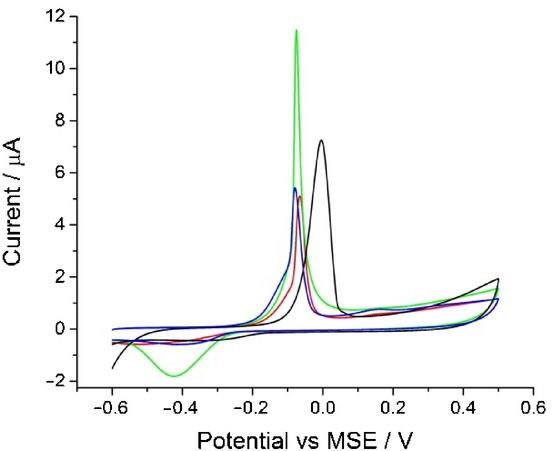
Figure 4.

The oxidation of silver nanoparticles on a glassy carbon electrode at a scan rate of 0.05 V s−1. Black: scan in 0.1 m NaNO3. Red: 0.1 m Na2HPO4. Green: 0.2 m Na2HPO4. Blue: 0.3 m Na2HPO4. Each data point consists of a minimum of three repeats.
