Figure 5.

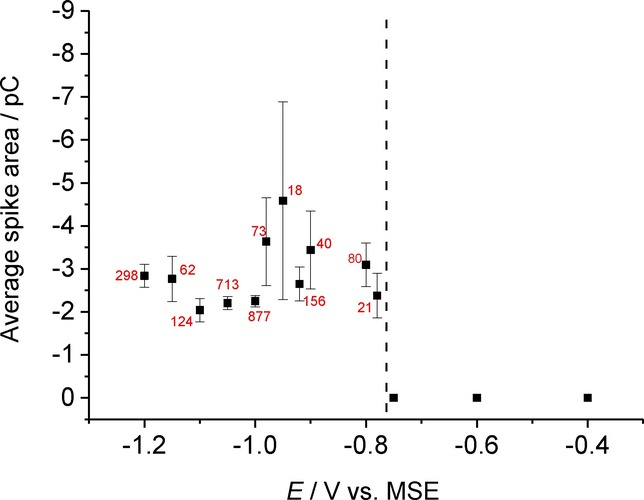
Average spike area as a function of applied potential in 0.10 m NaNO3. Dotted line indicates the switch-on potential for AgBr NP reduction. The numbers by each point indicate the number of spikes averaged to produce each data point.

Average spike area as a function of applied potential in 0.10 m NaNO3. Dotted line indicates the switch-on potential for AgBr NP reduction. The numbers by each point indicate the number of spikes averaged to produce each data point.