
Fig. 1.
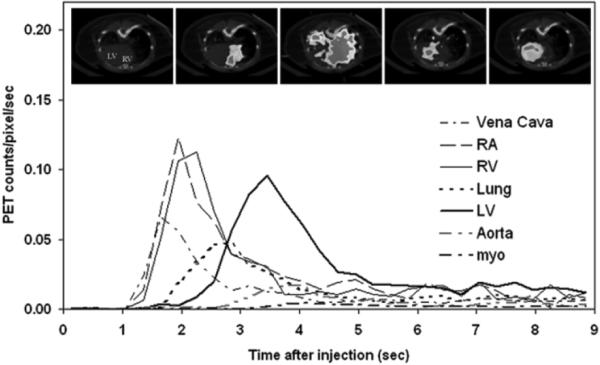
A typical example of first-pass angiography of a mouse FDG-PET study. The graph depicts the first nine seconds time activity curves (TACs) of the inferior vena cava, right atrium (RA), RV, lung, LV, descending aorta and myocardium (myo) following a tail-vein bolus injection of FDG. The TACs of the RV, lung and LV were well separated. The inserts reflect the fused CT and PET images at a mid-ventricular plane acquired at different times after FDG injection. The first insert on the left had no FDG uptake and showed CT image only. Inserts from the left to right were acquired at 0 sec, 2.1 sec, 2.7 sec, 3.1 sec and 10 min after FDG injection.