
Fig. 6.
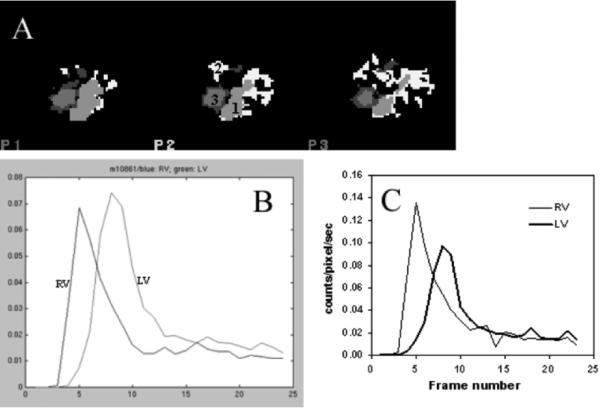
(a) Structural images and (b) RV and LV TACs of a mouse study generated by the clustering method. The CA method separated the RV, lung and LV (labeled as “1”, “2”, and “3” for RV, lung, and LV, respectively). (c) RV and LV TACs obtained from the same mouse using the ROI method.