
Figure 5.
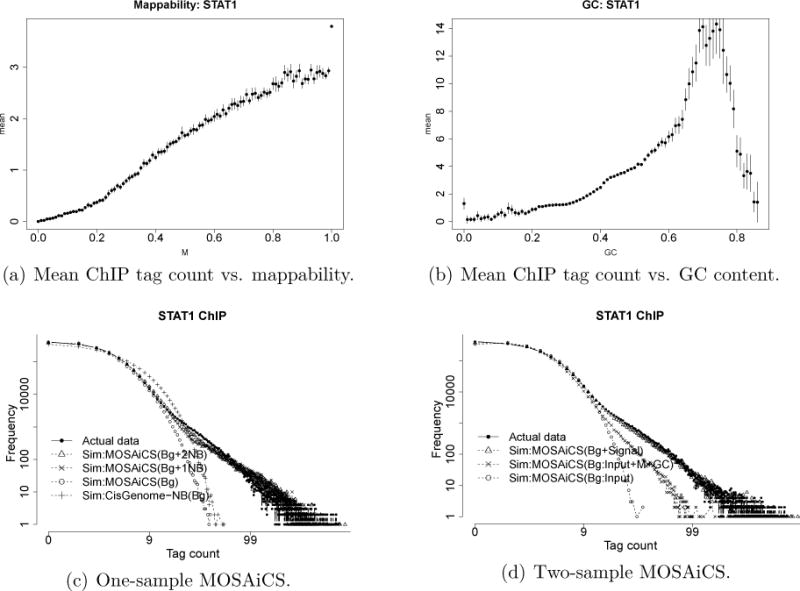
Mappability and GC content biases and goodness of fit for STAT1 ChIP-Seq sample. Panels (a) and (b) plot mean ChIP tag counts against the mappability score Mj and GC content GCj, respectively. Panels (c) and (d) are the goodness of fit plots from one- and two-sample MOSAiCS models. Axes on both panels are in log10 scale. In panel (c), the background is fitted using Mj and GCj. In panel (d), the background is fitted using Mj, GCj, and Xj, or Xj only. Simulated data from estimated one-sample background model of CisGenome is displayed in panel (c).