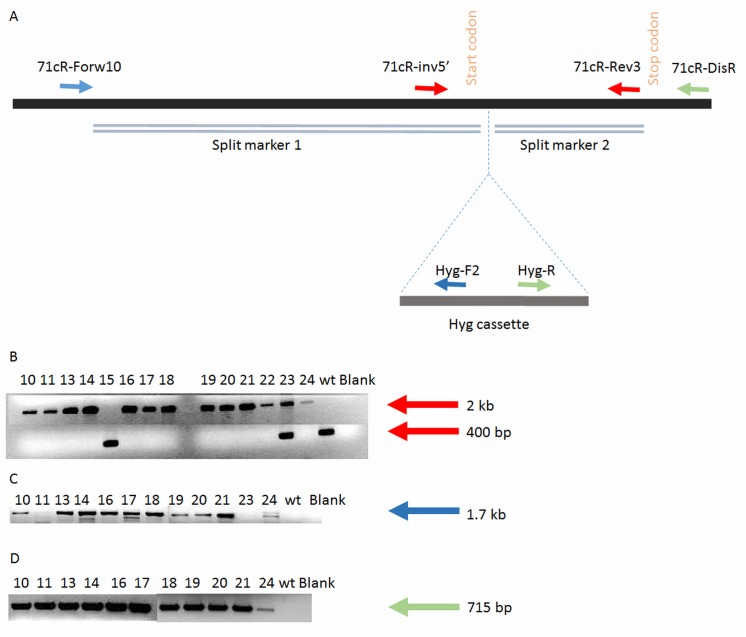
Fig 4. Disruption of 71cR.
A. The gDNA of wt C. nicotianae is shown as a black bar with the start and stop codons of 71cR indicated. In disrupted transformants the hyg cassette is predicted to integrate in the location specified by dotted lines. The homologous regions of each split marker are represented as double lines. Location of primers used in PCR screening is also shown. B. Gel image of screening putative 71cR disruptants with primers that span the hyg cassette integration site (71cR-Rev3 and 71cR-inv5’; red arrows in panel A). Integration results in a 2 kb band; wt band is 400bp (indication of non-disruptant genotype). Wild type C. nicotianae and transformant #15 showed only the wild type band; transformant #23 has both bands indicating an ectopic integration of the split markers. C. Bands represent the 1.7 kb amplification of the 5’ integration site by using a 71cR locus-specific forward primer outside the split marker 1 sequence (71cR-Forw10) and a reverse primer specific to the hyg cassette sequence (Hyg-F2) (blue arrows in panel A). D. Bands represent the 715 bp amplification of the 3’ integration site (Hyg-R and 71cR-DisR; green arrows in panel A).

