
Fig 7. Phylogenetic Tree of the LysE Superfamily.
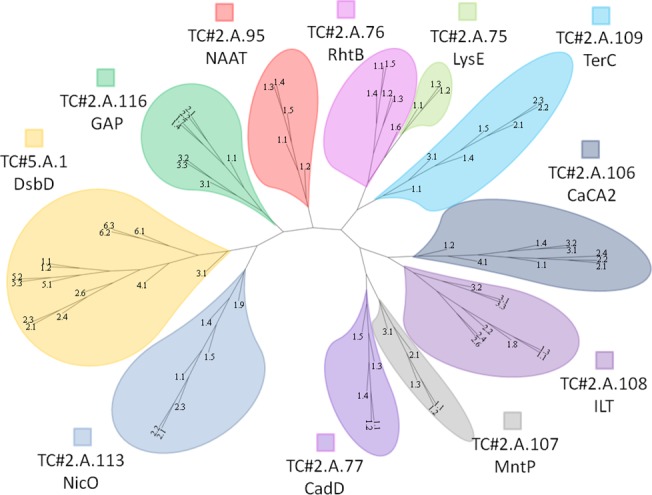
The tree was generated using the SuperFamilyTree program and viewed using FigTree. It depicts the evolutionary relationship between the 11 different families in this study. Clustering indicates closer phylogenetic relationships. The tree is based on tens of thousands of BLAST bit scores generated with the SFT1 program where every protein was compared with every other protein included in the analysis. The SFT2 program was used to integrate all of the information to show the relationships of the eleven families to each other. Associated bootstrap values can be found in S29 Fig. When using BLAST bit score comparisons for determining phylogeny, the bootstrap values become less indicative of the reliability and accuracy of observed clustering patterns for very closely related proteins [19].