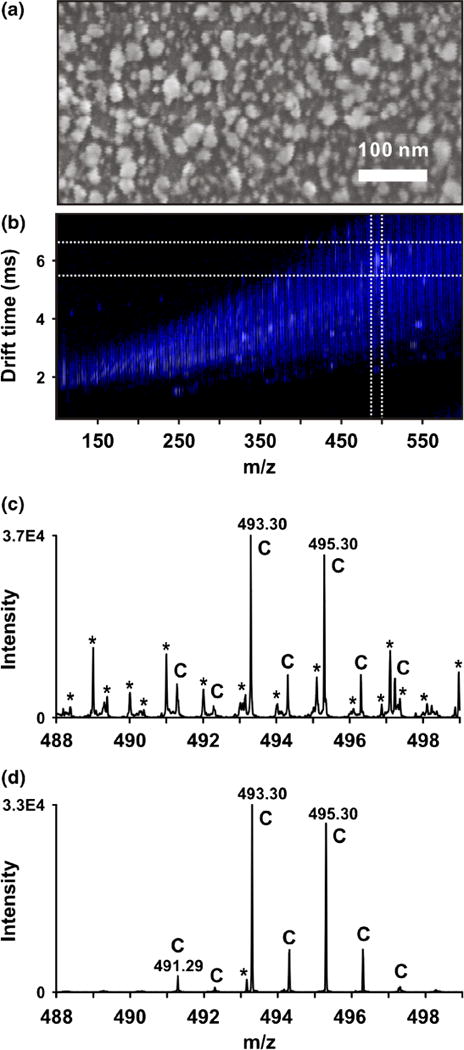
Figure 1.

Sputtered silver MALDI-IM-MS analysis of cholesterol standard on an ITO-coated glass MALDI plate. (a) Scanning electron microscopy image of nanoparticles formed from sputtered silver. Average particle size is approximately 20 nm. (b) Two-dimensional IM-MS spectrum of cholesterol standard. Cholesterol-silver adducts are highlighted in the white box. (c) Mass spectrum of cholesterol-silver adducts without IM separation (i.e., integrated across all drift times between m/z 488 and 498). Peaks corresponding to cholesterol and related species are labeled “C” and chemical noise is labeled with asterisks *. (d) Mass spectrum of cholesterol-silver adducts over the ion mobility drift time region indicated by dashed lines in (a). Significant S/N improvement of cholesterol is achieved via exclusion of chemical noise
