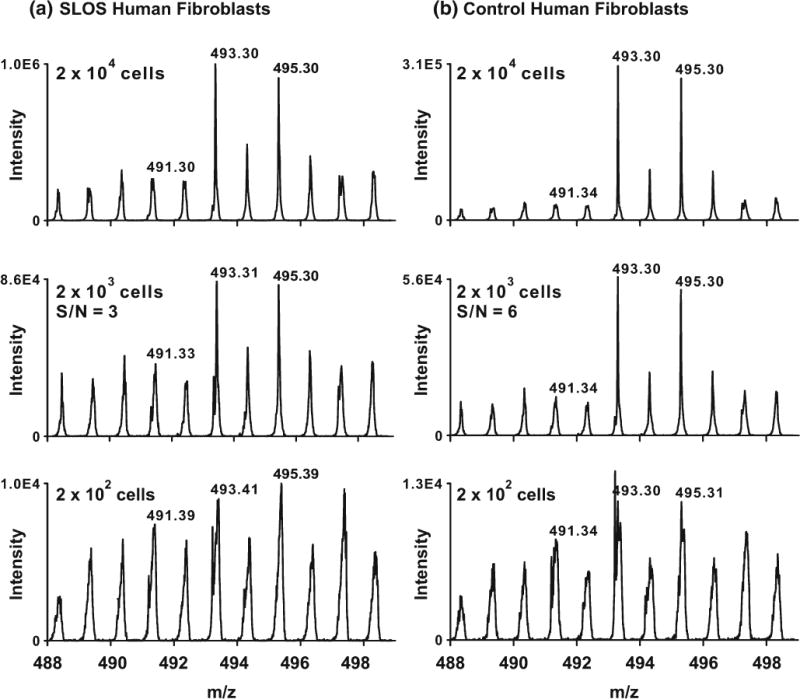
Figure 3.

Analysis of sterols in SLOS (a) and control (b) human fibroblasts. Cells were trypsinized and different concentrations of the cell suspension were spotted on target. S/N ratios were estimated by integrating the spectrum and dividing the area corresponding to m/z 493 by m/z 488 (corresponding to chemical and instrumental noise)
