Figure 4.

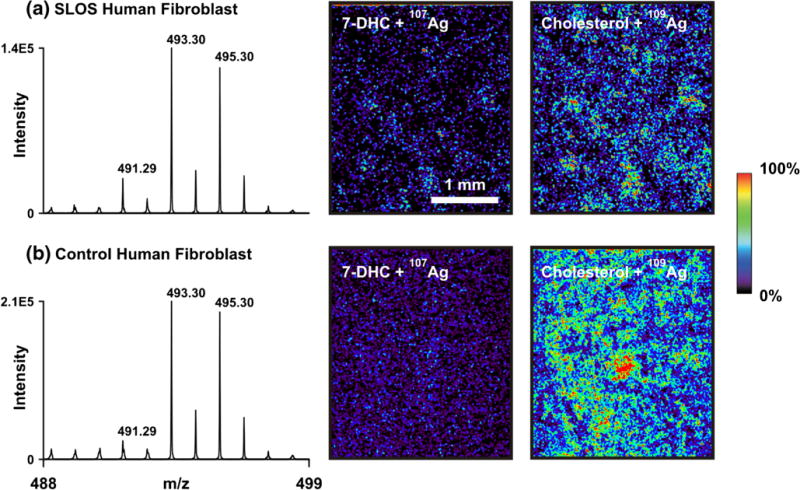
Imaging IM-MS of cholesterol and 7-DHC in SLOS (a) and control (b) human fibroblasts grown directly on ITO-coated plates. The m/z of 491 is specific for [7-DHC+107Ag]+ and 495 is specific for [cholesterol−109Ag]+

Imaging IM-MS of cholesterol and 7-DHC in SLOS (a) and control (b) human fibroblasts grown directly on ITO-coated plates. The m/z of 491 is specific for [7-DHC+107Ag]+ and 495 is specific for [cholesterol−109Ag]+