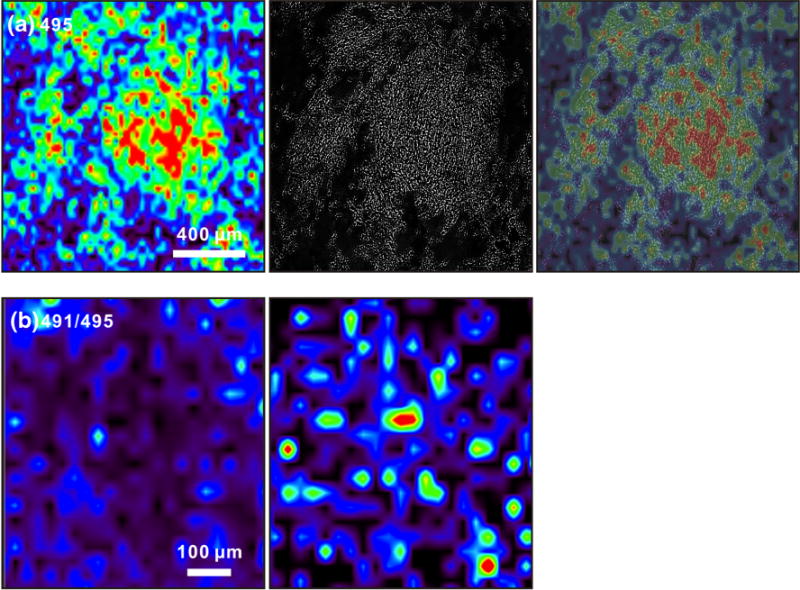
Figure 5.

(a) Imaging IM-MS of cholesterol at m/z 495 (left), an optical image of the field of cells (center), and an overlay of both images (right) illustrating co-registration of the optical and m/z images. (b) Imaging IM-MS of the ratio of [7-DHC+107Ag]+/[cholesterol+109Ag]+ (m/z 491/495) in control (left) and SLOS (right) human fibroblast cells. The ratio of these two ion images is obtained through ratioing the signal intensities of each specific m/z at each pixel coordinate
