
Fig 3. Effect of exercise on blood pressure and resting heart rate in normal weight (NWG), overweight (OVG) and obese (OBG) groups.
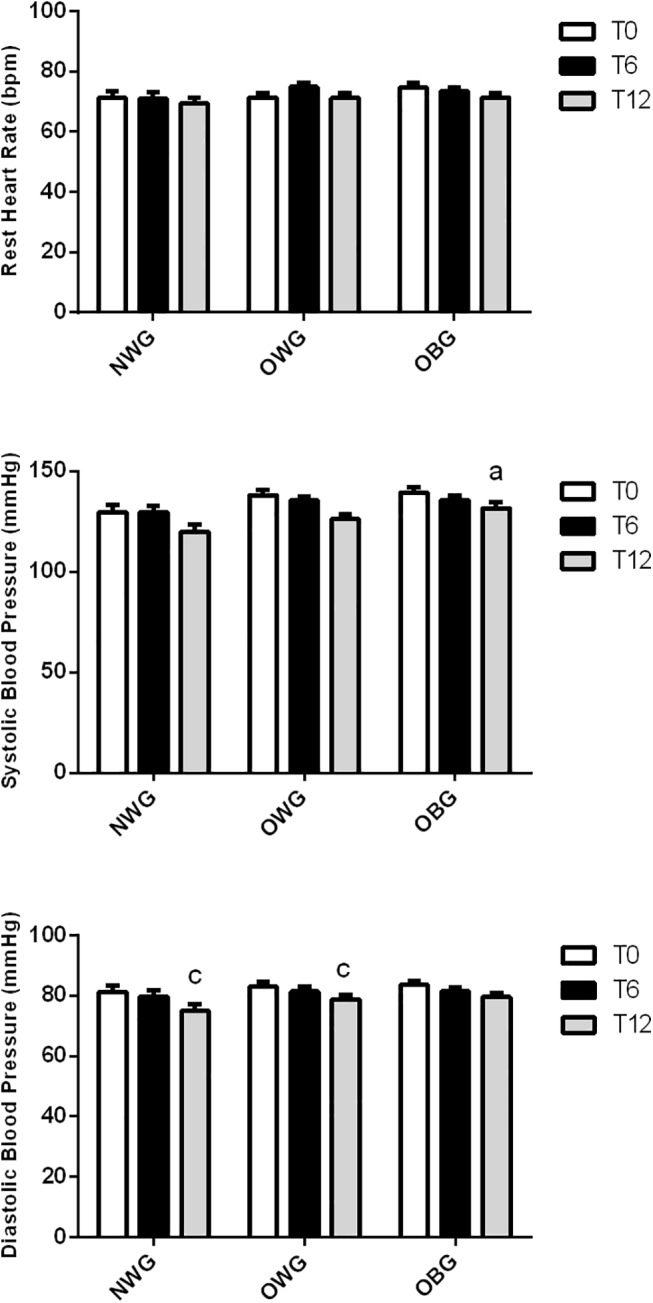
The systolic and diastolic blood pressure was evaluated before (T0), after 6 months (T6) and 12 months (T12) of the exercise training program. The values presented are the mean ± standard error of mean. a comparison to normal weight group; c comparison to before training.