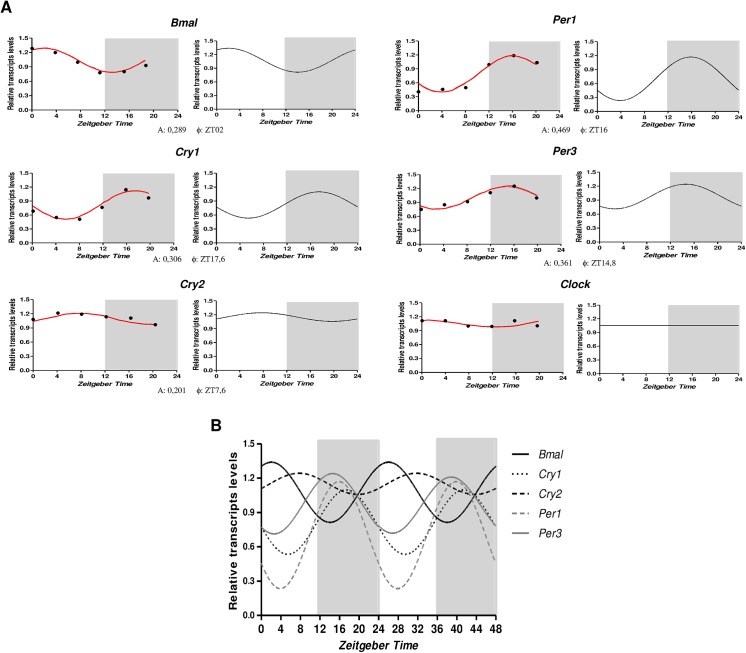
Fig 3. Temporal expression of the core clock transcripts in the hippocampus of rats.
A) Relative amounts of transcripts at different ZT after normalization to Tubb2a/Rplp1. Data are presented as mean (n = 5 rats/ZT). Statistical test for circandian analysis by Acrophase (left) and CirWawe (right). B) Overlap of cosine fitting curves illustrating the phase relation of clock transcripts. For clarity reasons, data are doubleblotted against Zeitgeber time (ZT).

