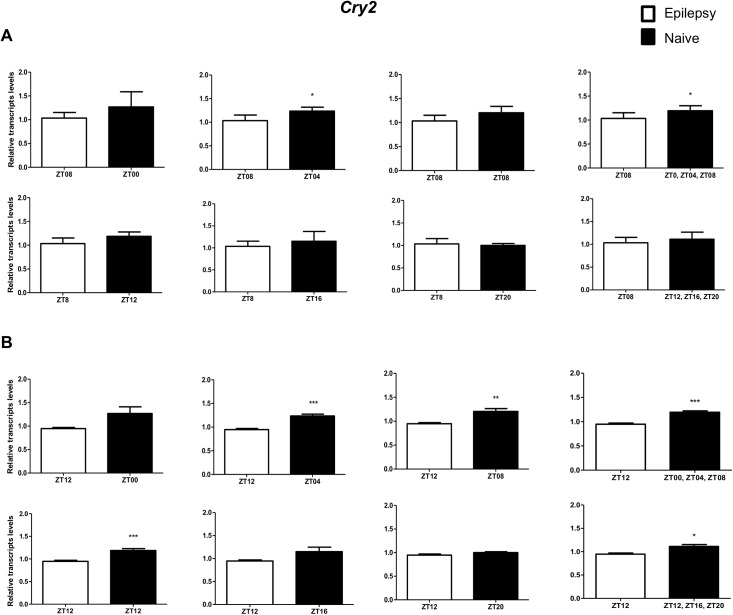
Fig 8. Impact of diurnal variation on Cry2 expression analysis in hippocampus of epileptic rats.
Relative amounts of Cry2, transcripts in epileptic rats ZT08 (A) and ZT12 (B) after normalization to Tubb2a/Rplp1. Significant differences were evaluated using Unpaired Student’s t-test comparing results between epileptic and each ZT of naive group. *p<0.05, **p<0.01 and ***p<0.001. Data are presented as mean+SEM (n = 5 (ZT8) and 4 (ZT12) rats in epileptic group and n = 5 rats/time point in naive).

