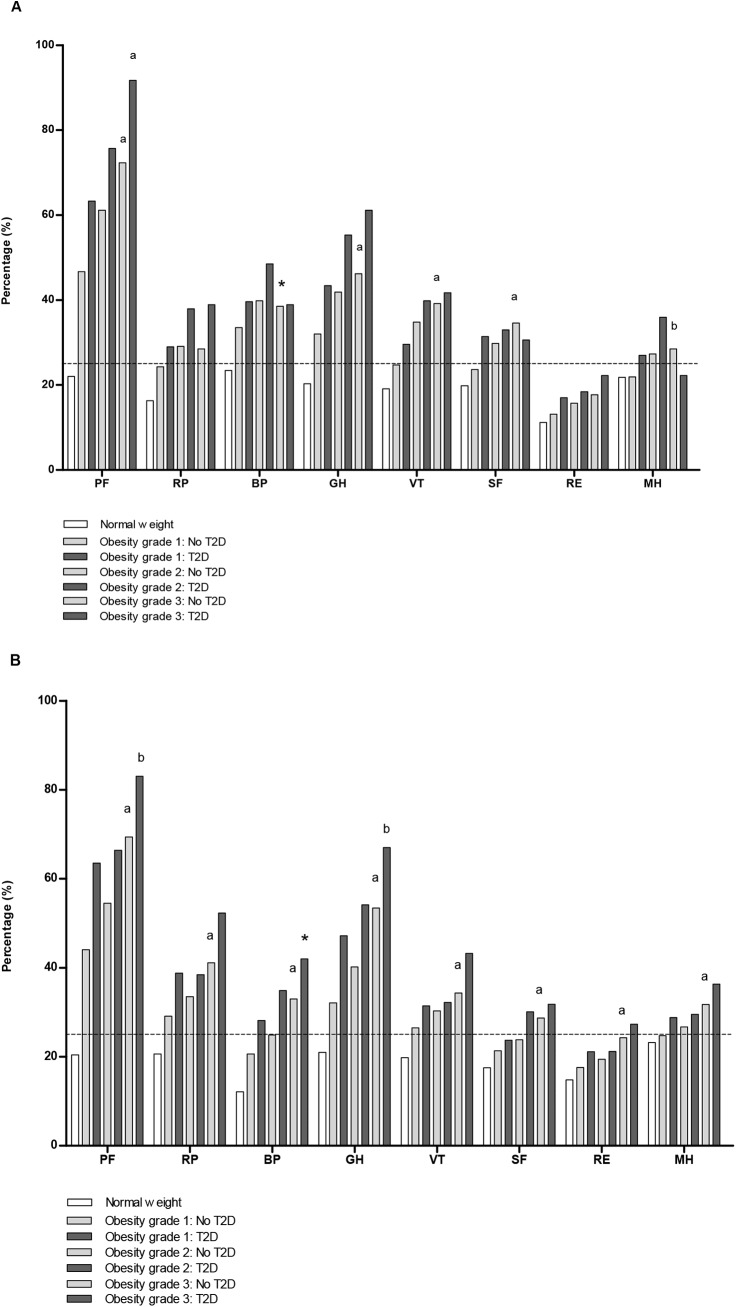
Fig 1. Percentages of obese individuals with a poor HR-QoL domain score, according to obesity grade with and without T2D.
(A) Men. (B) Women. Obesity grade 1: BMI 30–34.9 kg/m2 Obesity grade 2: BMI 35–39.9 kg/m2 Obesity grade 3: BMI ≥40 kg/m2 The corresponding cut-off value derived from the scores in the normal weight population for the individual domains (25th percentile men, 25th percentile women): PF = physical functioning (95.0, 90.0); RP = role limitations due to physical health problems (100.0, 100.0); BP = bodily pain (79.6, 67.4); GH = general health (65.0, 65.0); VT = vitality (60.0, 55.0); SF = social functioning (87.5, 75.0); RE = role limitations due to emotional problems (100.0, 100.0); MH = mental health (76.0, 72.0). Mantel-Haenszel tests was used to check for a linear trend in proportions across groups of obesity grade without T2D and separately for groups of obesity grade with T2D. * indicates a linear trend at P <0.005; a P <0.001; and b P <0.002.

