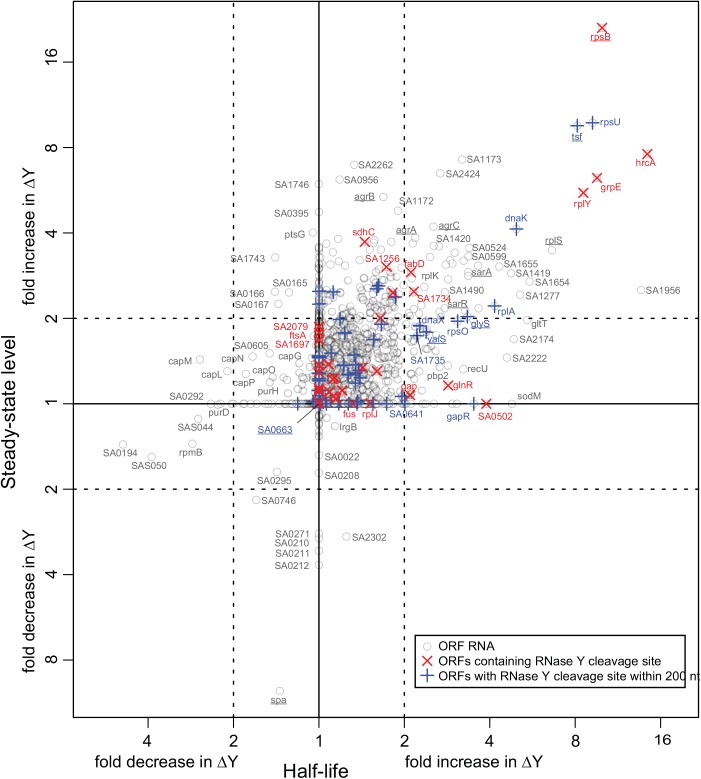
Fig 1. Correlation between changes in half-lives and steady-state levels.
The change between WT and ΔY in the half-life of each ORF was estimated using a smallest-difference model, and the same was done for the steady-state levels of the ORFs. The fold-change in half-life is plotted on the x-axis and the fold-change in steady-state level on the y-axis. Each grey circle represents an ORF transcript where sufficient data was available (1464 in all), and the names of ORFs discussed in this study are underlined. Red X's show which ORFs contain an identified RNase Y cleavage, and blue +'s show the ORFs where an RNase Y site was identified within 200 nt of an ORF.

