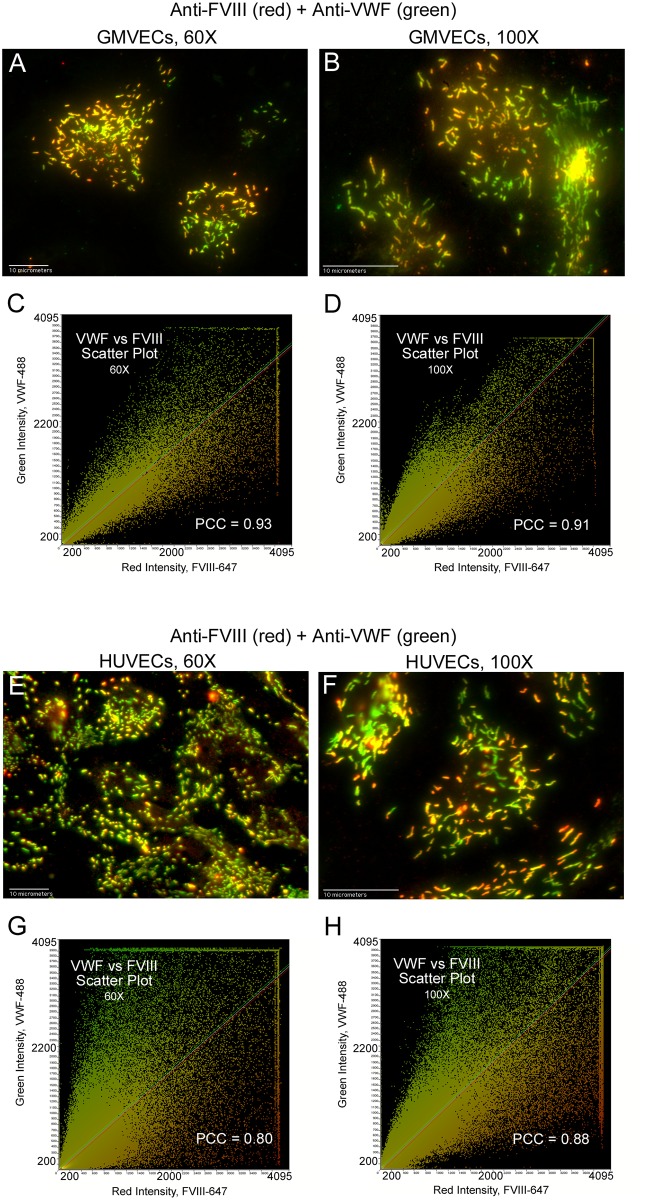
Fig 5. Statistical confirmation of the presence of FVIII and VWF in WPBs.
GMVECs and HUVECs were treated with Triton-X to allow internal staining. Cells were then stained with mouse monoclonal anti-human FVIII plus goat anti-mouse IgG AF-647 (red) followed by staining with rabbit anti-human VWF plus chicken anti-rabbit IgG AF-488 (green). Merged images of FVIII and VWF detection, along with the corresponding intensity scatter plot, are shown in: (A and C) GMVECs at 60×, N = 4; (B and D) GMVECs at 100×, N = 5; (E and G) HUVECs at 60×, N = 7; and (F and H) HUVECs at 100×, N = 7. Values for Pearson’s correlation coefficient (PCC) are on each scatter plot.

