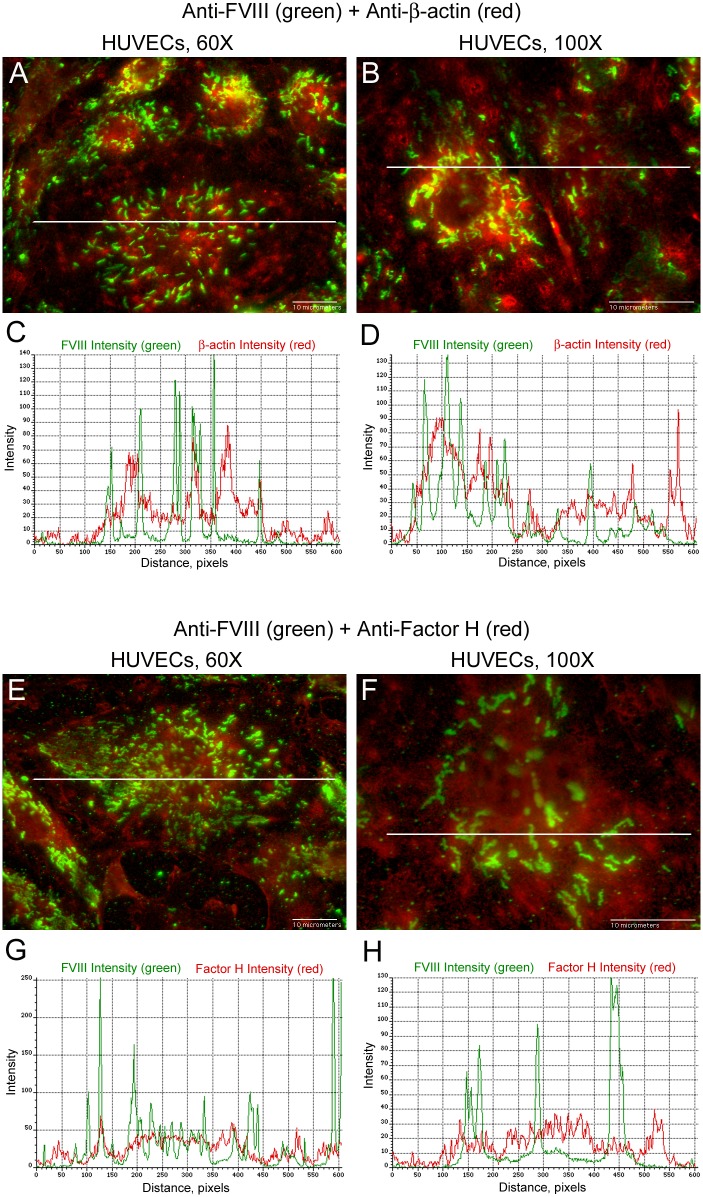
Fig 8. Intensity measurements of FVIII in HUVEC WPBs are not synchronized with intensities of β-actin or Factor H.
HUVECs were internally stained with mouse monoclonal anti-human FVIII plus donkey anti-mouse IgG AF-488 (green), followed by staining either (A and B) with goat anti-β-actin plus chicken anti-goat IgG AF-647 (red) or (E and F) with goat anti-Factor H plus chicken anti-goat IgG AF-647 (red). Graphs below each merged image show the green intensity values of FVIII plus either: (C and D) the red intensity values of β-actin; or (G and H) the red intensity values of Factor H. The intensity values in the graphs were measured along lines that traverses FVIII detection in WPBs. Line lengths are 68 μm in 60× images and 35 μm in 100× images. N = 4 for FVIII measurement with β-actin and N = 3 for FVIII measurement with Factor H.

