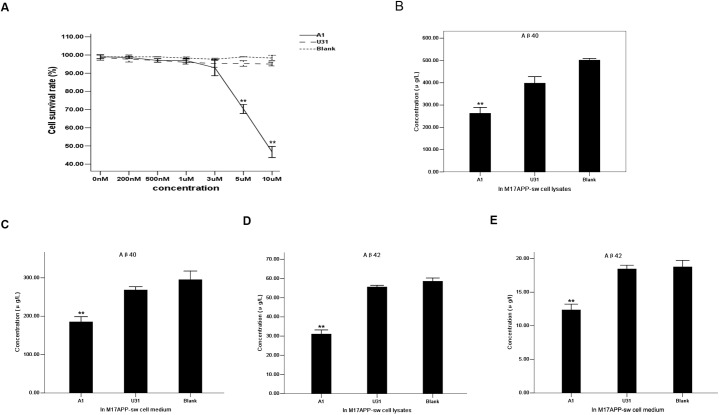
Fig 4. Specific inhibitory effect of aptamer A1 on BACE1 activity in an AD cell model.
(A) Effects of different concentrations of A1 on M17-APPsw cell survival rate using MTT assay. A1 group: straight line. U31 group: dashed line. Blank control group: dotted line. The data are represented as the mean±SD (n = 3). **P <0.01 compared with the 0 nM group. (B-C) Comparison of Aβ40 concentrations secreted within M17-APPsw cells (B) and media (C) among the A1, U31 and blank control groups. (D-E) Comparison of Aβ42 concentrations secreted within M17-APPsw cells (D) and media (E) among these groups. In B-E, the data are represented as the mean±SD (n = 3). **P <0.01 compared with the U31 and blank control groups.

