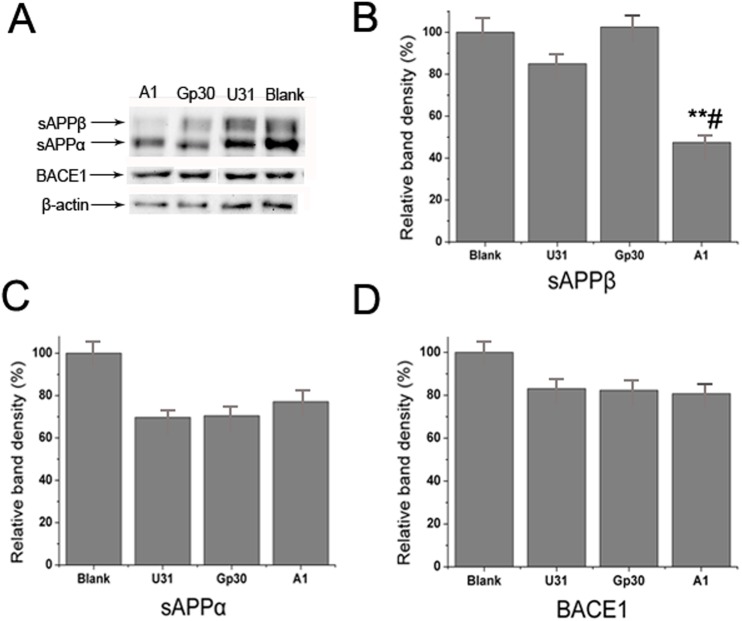
Fig 5. Specific inhibitory effect of aptamer A1 on BACE1 activity in an AD cell model.
(A) Western blot analysis of sAPPα, sAPPβ and BACE1 expressions in the A1, Gp30, U31 and blank control groups. (B-D) Quantitative analysis of the sAPPβ (B), sAPPα (C) and BACE1 (D) bands among groups. The data are represented as the mean±SD (n = 3). **P<0.01 compared with the Gp30 and blank groups. # P<0.05 compared with the U31 group.

