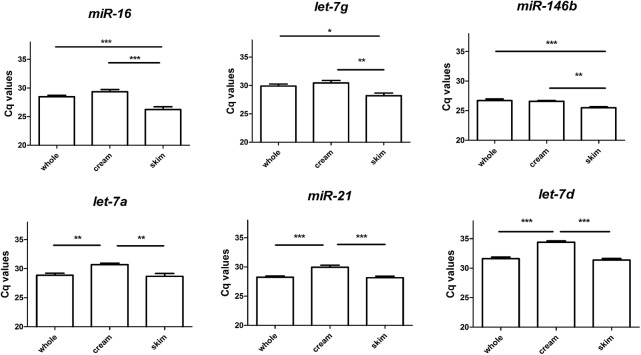
Fig 3. Differences in miRNA expression levels between whole milk, lipids and skim milk.
Raw Cq data of endogenous references (let-7a, let-7g, let-7d, miR-16, miR-146b and miR-21) analyzed in full milk, lipids, and skim milk, were represented in a Tukey box plot. MiR-21, let-7a and let-7d expression was significantly lower in lipids than in skim and full milk, while no differences were found between skim milk and whole milk. MiR-16, let-7g and miR-146b expression was significantly higher in skim milk fractions than in lipids and in full milk (*p<0.05; **p<0.01; ***p<0.001).

