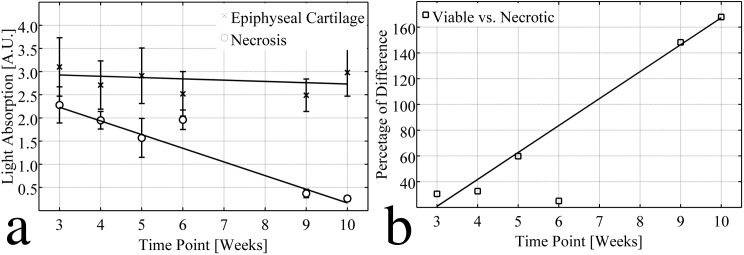
Fig 3. Linear regression analysis of the optical density experiment.

(A) Light absorptions (A.U.) for viable (x, R2 = 0.129) and necrotic (o, R2 = 0.989) epiphyseal cartilage were fitted linearly to different time points, indicating that the PG content remained stable in the viable epiphyseal cartilage, but decreased linearly with time in the areas of chondronecrosis. (B) The % difference between light absorption by viable and necrotic epiphyseal cartilage was fitted linearly to different time points (R2 = 0.993). Although slight PG loss was observed in the 6-week sample, this point was excluded from the analysis because no histologically evident chondronecrosis was observed.
