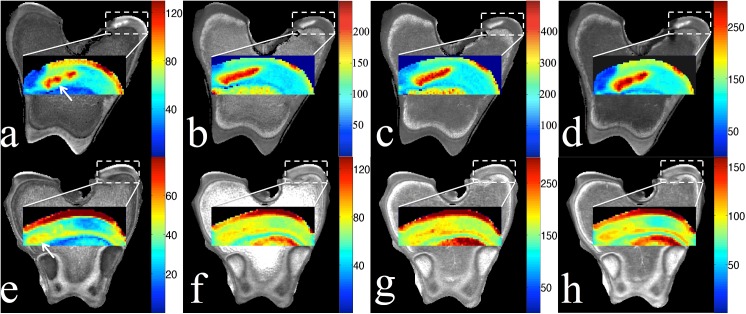
Fig 4. Parametric MRI images of femoral condyle.
Relaxation time maps for (A, E) T2, (B, F) T1ρ, (C, G) adiabatic T1ρ, and (D, H) TRAFF in the medial condyle of the distal femur at 5 weeks (top row, large lesion) and 6 weeks (bottom row, small lesion) post-surgically. Lesion locations are indicated by the arrows in the T2 maps.

