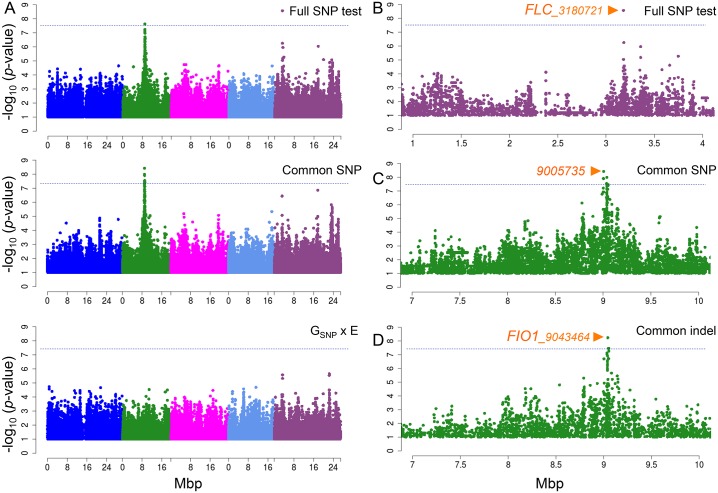
Fig 2. Manhattan plots of GWAS results for flowering time at 10°C and 16°C using MTMM.
A. From top to bottom, results for full SNP, common SNP effect, and GSNP x E effect tests. B. Zoom-in on chromosome 5 peak from full SNP test. C. Zoom-in on chromosome 2 peak from common effect by SNP markers, and D. by indel markers. Orange arrows show position of the strongest association in the peak. Horizontal dashed lines show 5% genome-wide significance thresholds after Bonferroni-correction.

