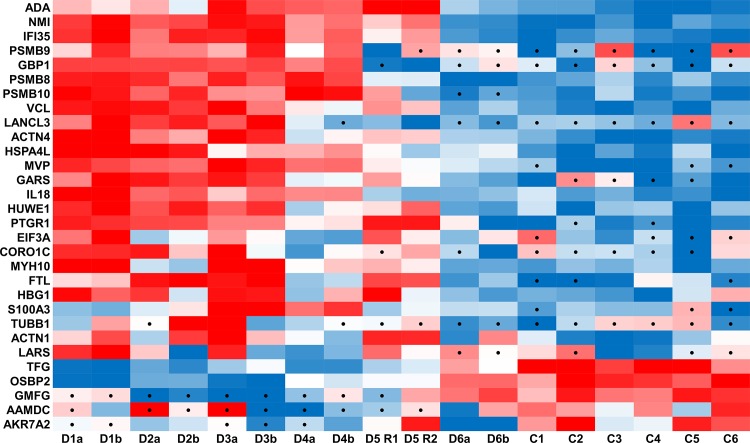
Fig 6. Heatmap of significantly changed proteins.
Protein intensity z-scores of significantly changed proteins listed in Table 2. Red denotes high relative protein intensity while blue indicates low intensity with black dots signifying zero values that were imputed for statistical analysis.

