
Figure 5. Pairwise correlations between selected patient-reported outcomes and performance tests in patients with MS.
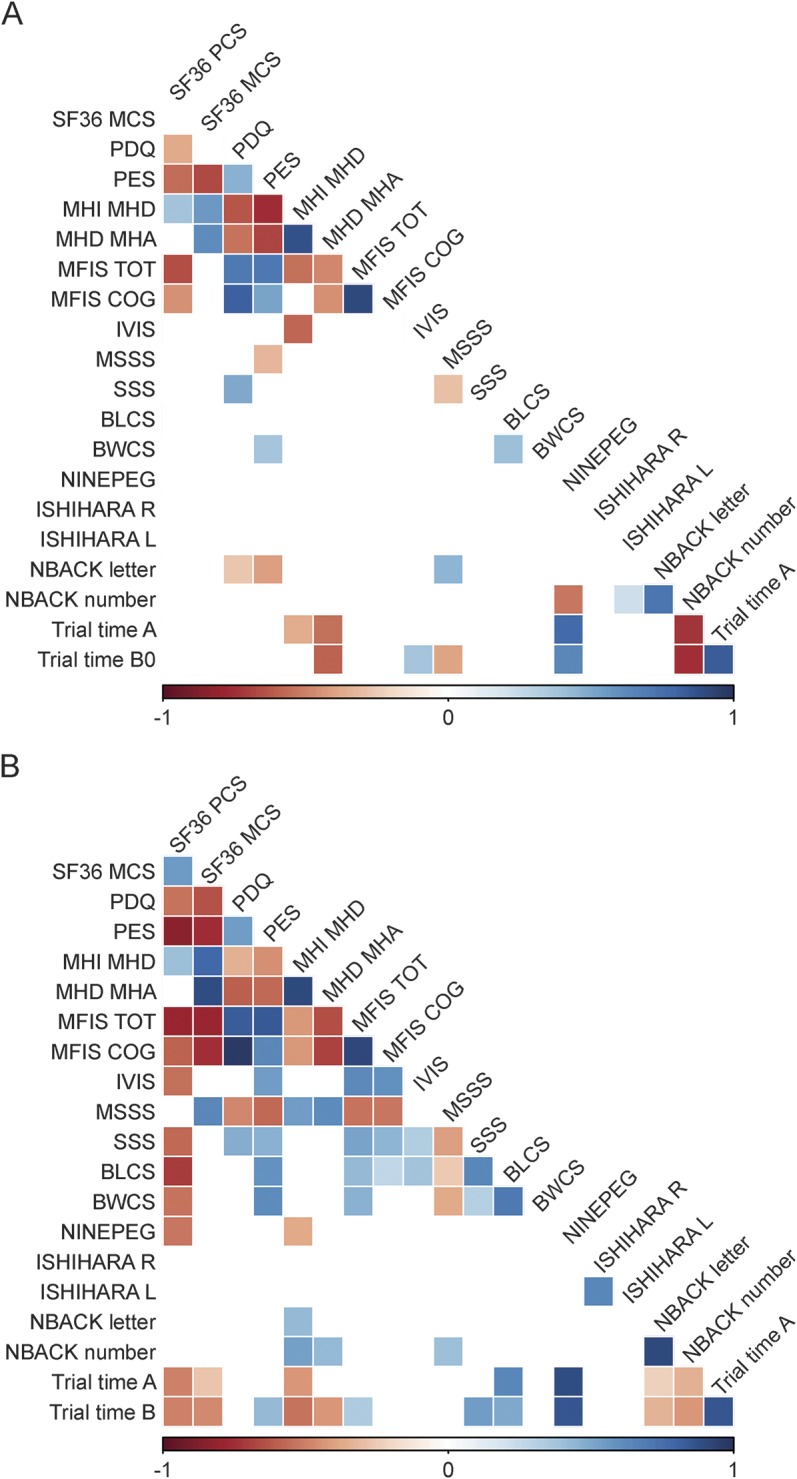
(A) The number of pairwise correlations meeting a nominal p < 0.05 significance when the first measure obtained from each participant is used. (B) The number of pairwise correlations meeting the nominal p < 0.05 threshold when the mean of all responses for an individual patient with multiple sclerosis (MS) is used, omitting a 3-test run-in. The number of significant correlations increases from 46 to 88. The intensity of the color is proportional to the strength of the correlation, with positive correlations denoted in blue and inverse correlations in red.