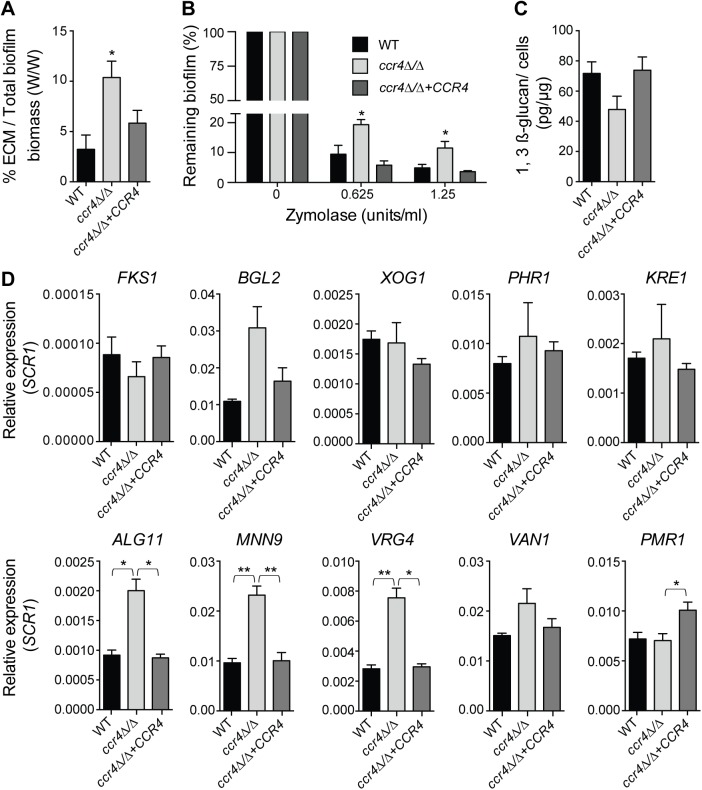
Fig 7. Effects of CCR4 on the extracellular matrix and biofilm stability.
(A) Quantification of total extracellular matrix (ECM) in C. albicans biofilms. Biofilms were grown in Spider medium and collected after 48 h. The proportion of ECM was calculated relative to the total biofilm biomass (cells + ECM), as determined by dry weight measurement (see Materials and Methods). Results were calculated from three biological repeats in technical triplicates. Shown are the averages and the standard errors. P value of the difference between WT and ccr4Δ/Δ is shown as * <0.05. (B) Biofilms were grown in 96-well microtiter plates in RPMI-MOPS for 24 h and then exposed to zymolyase (20T) prepared in RPMI-MOPS + 0.9% NaCl (1:1 ratio) for 24 h. The remaining biomass was quantified by crystal violet staining. Results were calculated from three biological repeats in technical duplicates. Shown are the averages and the standard errors. P value of the difference between WT and ccr4Δ/Δ is shown as * < 0.05. (C) Matrix 1,3 β-glucan was quantified from biofilms grown in Spider medium as described in Materials and Methods. The yield of 1,3 β-glucan was calculated as the weight of 1,3 β-glucan (pg) per 1 μg of biofilm cells. Results were calculated from 6 biological repeats. Shown are the averages and the standard errors. Differences: WT versus ccr4Δ/Δ, p = 0.067; ccr4Δ/Δ + CCR4 versus ccr4Δ/Δ, p = 0.062. (D) qPCR analysis for the indicated transcripts was performed on biofilms grown for 48 h in Spider medium and data normalized to SCR1 RNA. Error bars are ± standard errors of the average of 3 biological replicates. P values are as follows: ** <0.01 or * <0.05.

