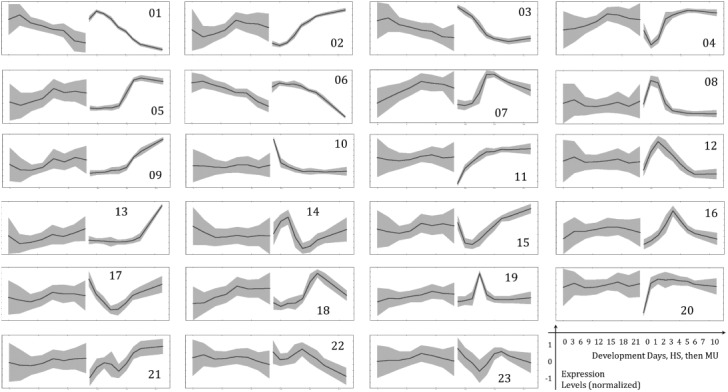
Fig 2. Mouse clusters.

23 clustered expression profile sets are shown. The right part of each graph is the expression profile of (clustered) mouse genes and the left–for corresponding human genes. A line on the graphs is an average expression and grey areas indicate standard deviation of individual expression values with respect to average. Before clustering the standard deviation of expression profiles was set to 1, in order to make the results independent of specific probe set properties.
